
Mastering Power BI Embedding: A Comprehensive Guide for Developers
Kushal BaldevAugust 14, 2024
Share this article


In today’s data-driven world, the ability to visualize data effectively is more critical than ever. Power BI, a powerful business analytics tool from Microsoft, allows users to create interactive and insightful reports and dashboards. But what if you could embed these rich visualizations directly into your applications, making data insights more accessible and actionable for your users? This blog aims to guide you through the process of embedding Power BI reports into your applications, unlocking new levels of interactivity and customization. Whether you’re a developer, a business analyst, or an IT professional, this comprehensive guide will provide you with the knowledge and tools you need to master Power BI embedding.
Row-level security (RLS) with Power BI can be used to restrict data access for given users. Filters restrict data access at the row level, and you can define filters within roles. In the Power BI service, users with access to a workspace have access to semantic models in that workspace. RLS only restricts data access for users with Viewer permissions. It doesn’t apply to Admins, Members, or Contributors. You can configure RLS for data models imported into Power BI with Power BI. You can also configure RLS on semantic models that are using Direct Query, such as SQL Server. For Analysis Services or Azure Analysis Services lives connections, you configure row-level security in the model, not in Power BI. The security option doesn’t show up for live connection semantic models.
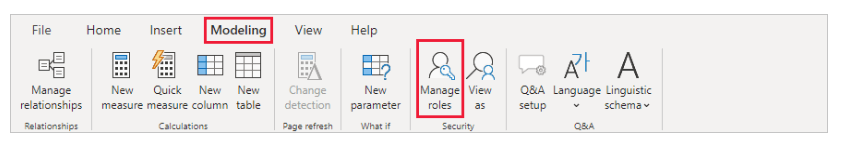
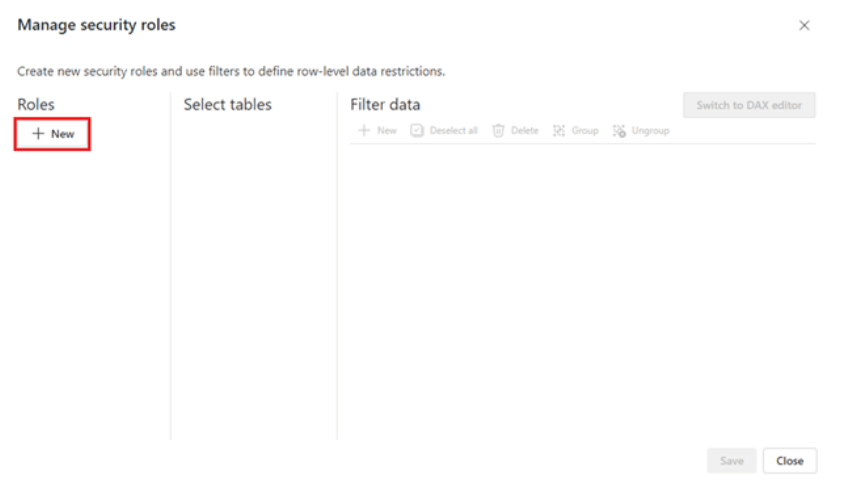
For Implementing Power BI Embed with RLS we need to install Power BI desktop Application in your machine. You can define roles and rules within Power BI Desktop. With this editor, you can toggle between using the default drop-down interface and a DAX interface. When you publish to Power BI, you also publish the role definitions. To define security roles:
If you publish your Power BI Desktop report to a workspace in the Power BI service, the RLS roles are applied to members who are assigned to the Viewer role in the workspace. Even if Viewers are given Build permissions to the semantic model, RLS still applies. For example, if Viewers with Build permissions use Analyze in Excel, their view of the data is restricted by RLS. Workspace members assigned Admin, Member, or Contributor have edit permission for the semantic model and, therefore, RLS doesn’t apply to them. If you want RLS to apply to people in a workspace, you can only assign them the Viewer role. Read more about roles in workspaces.
You can see the current limitations for row-level security on cloud models here:
Keep in mind that if a Power BI report references a row with RLS configured then the same message displays as for a deleted or non-existing field. To these users, it looks like the report is broken.
Static security uses a fixed value in the DAX filter to define each role. It’s simple to implement but difficult to maintain when there are many users or organizations involved. Static security works best for an ISV that serves one or a few big customers where each department needs to access different data. Dynamic security uses a DAX function (username() or userprincipalname()) to define the roles. Dynamic security provides more flexibility and allows you to manage your data using fewer roles and less maintenance.
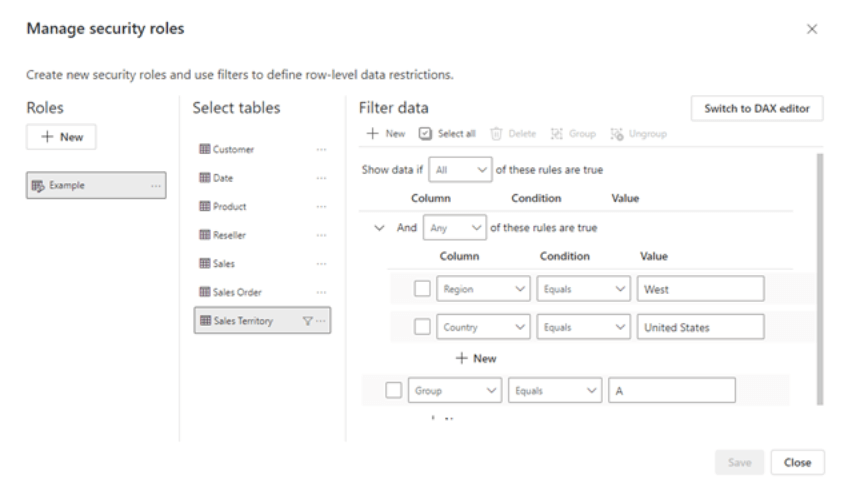
With static roles, you pass the role to Power BI when you generate an embed token, and the user sees data according to that role. To create static security roles, enter a fixed value in the DAX filter. For example, you can define the role of Eastern US as [Region] = "East"
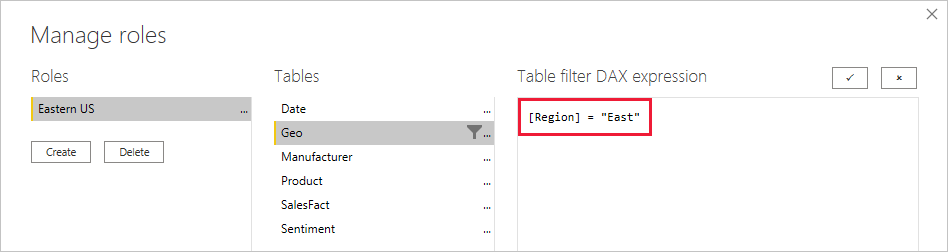
Let’s say john@contoso.com is a user of your app. You want to give John access to data from the Eastern US role. To embed a report for john@contoso.com, generate an embed token using the Eastern US role. The resulting data is filtered for [Region] = "East".
Dynamic security uses the DAX function (username() or userprincipalname()) to define the role. In the user owns data scenario, the RLS model automatically filters data based on the roles of the specific user. With app owns data, Power BI doesn’t know the usernames of the ISV’s customers, so you can use the username() function to dynamically filter the data. Create a role in Power BI Desktop using the username() function. For example, you can create a role called CountryDynamic and define it as [CountryRegionCode] = username()
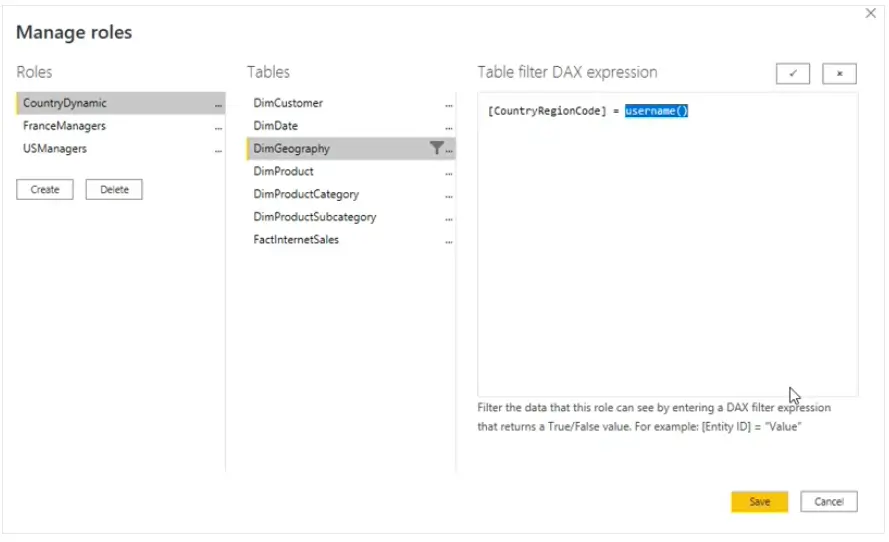
Let’s say you want to give your user, jane@contoso.com, access to data for France. When you generate an embed token for jane@contoso.com, you pass the string France as the username in the CountryDynamic role. Your data is filtered according to [CountryRegionCode] = France.
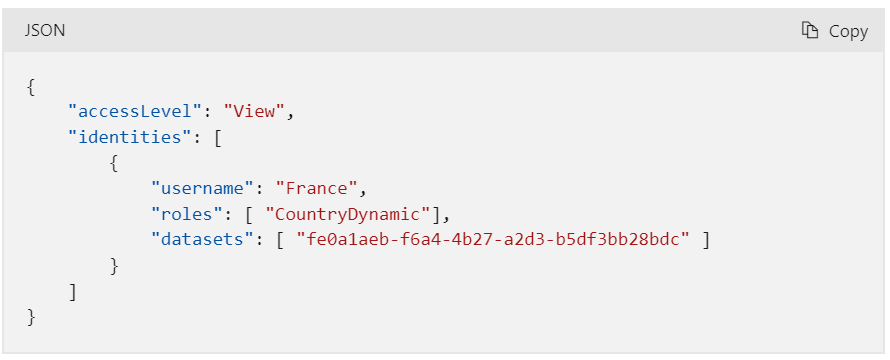
When using dynamic security in this scenario, you only need one role for all regions. The region name is used as the effective identity.
When you’re ready to embed the report into your app, you need to generate an embed token. To generate a token using the Embed Token API, pass the following information to the API.
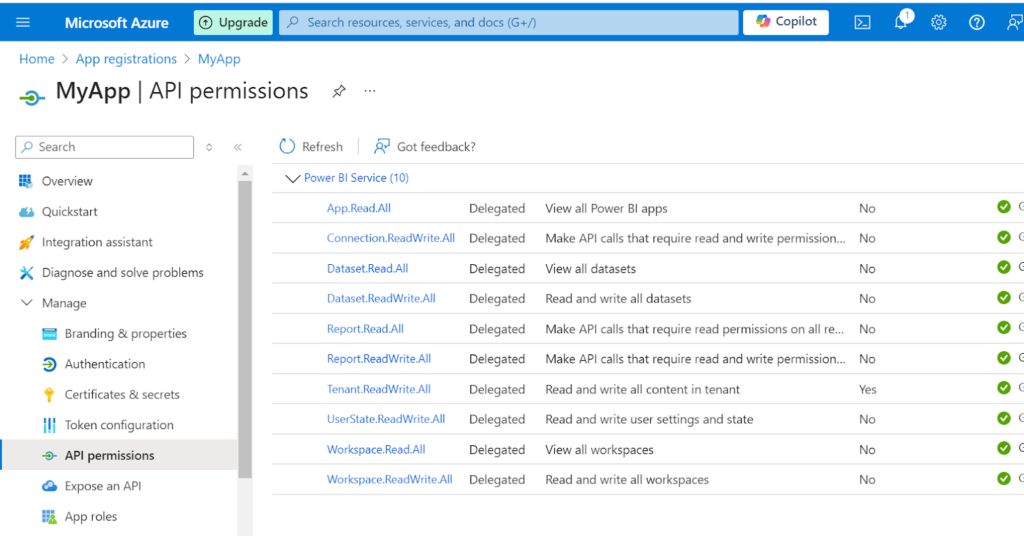
You can now embed the report into your app. The report filters data according to the RLS applied. For Embed token its Necessary that you have AD Auth token that is the bearer token Steps for the bearer token is as below
https://login.microsoftonline.com/{tenant-Id}/oauth2/v2.0/token
Set the body to x-www-form-urlencoded and include the following key-value pairs:
After that you can generate the embed report URL with Power BI rest API Steps for generating embed URL as below
After one has done the below process
Last is to view the report that we have generated in power BI with Application one can use the SDK’s for the same. Here is the quick way to check if everything working what you have generated by simple HTML page and inside we can add a JavaScript file.
<!DOCTYPE html>
<html lang="en">
<head>
    <meta charset="UTF-8">
    <meta name="viewport" content="width=device-width, initial-scale=1.0">
    <title>Embed Power BI Report</title>
    <script src="https://cdn.jsdelivr.net/npm/powerbi-client@2.23.1/dist/powerbi.min.js"></script>
    <style>
        #reportContainer {
            height: 100vh;
            width: 100%;
        }
    </style>
</head>
<body>
    <div id="reportContainer"></div>
    <script>
        // Replace these variables with your own values
        const embedUrl = 'YOUR_EMBED_URL_HERE'; // The embed URL of the report
        const embedToken = 'YOUR_EMBED_TOKEN_HERE'; // The embed token for the report
        const reportContainer = document.getElementById('reportContainer');
        const config = {
            type: 'report',
            tokenType: window['powerbi-client'].models.TokenType.Embed,
            accessToken: embedToken,
            embedUrl: embedUrl,
            id: 'YOUR_REPORT_ID_HERE', // The ID of the report
            settings: {
                filterPaneEnabled: true,
                navContentPaneEnabled: true
            }
        };
        // Embed the report
        const report = powerbi.embed(reportContainer, config);
        // Timeout variable
        let renderTimeout;
        // Function to handle timeout
        function handleTimeout() {
           console.error('Report rendering timed out.');
            alert('Report not available to view');
        }
        // Set timeout for rendering the report
        renderTimeout = setTimeout(handleTimeout, 9000); // Timeout duration in milliseconds
        // Event handlers for better error tracking
        report.on('loaded', function() {
            console.log('Report loaded successfully');
        });
        report.on('rendered', function() {
            console.log('Report rendered successfully');
            clearTimeout(renderTimeout); // Clear timeout if rendering is successful
        });
        report.on('error', function(event) {
            console.error('Error embedding report: ', event.detail);
            alert('Error embedding report: ' + event.detail.message);
            clearTimeout(renderTimeout); // Clear timeout if an error occurs
        });
    </script>
</body>
</html>
Kushal Baldev
Kushal Baldev is currently serving as a Technical Lead at NextGenSoft, bringing over 8.5 years of experience in software development and technology leadership. With a strong background in designing scalable systems and leading high-performing teams, Kushal has played a pivotal role in delivering innovative solutions across various domains.At NextGenSoft, he leads cross-functional teams, mentors junior developers, and collaborates with stakeholders to drive digital transformation initiatives. His dedication to continuous learning and staying updated with emerging trends has made him a valuable asset in the tech community.
We’re ISO/IEC 27001:2022 certified, ensuring your projects are executed with globally recognized security standards.
INDIA